Package org.jfree.chart.renderer.xy
Class XYStepAreaRenderer
java.lang.Object
org.jfree.chart.renderer.AbstractRenderer
org.jfree.chart.renderer.xy.AbstractXYItemRenderer
org.jfree.chart.renderer.xy.XYStepAreaRenderer
- All Implemented Interfaces:
Serializable,Cloneable,EventListener,AnnotationChangeListener,LegendItemSource,XYItemRenderer,PublicCloneable
public class XYStepAreaRenderer
extends AbstractXYItemRenderer
implements XYItemRenderer, Cloneable, PublicCloneable, Serializable
A step chart renderer that fills the area between the step and the x-axis.
The example shown here is generated by the
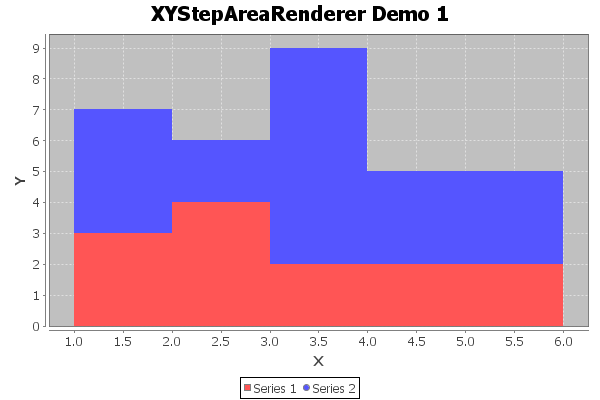
XYStepAreaRendererDemo1.java program included in the JFreeChart
demo collection:
- See Also:
- Serialized Form
-
Field Summary
Fields Modifier and Type Field Description static intAREAUseful constant for specifying the type of rendering (area only).static intAREA_AND_SHAPESUseful constant for specifying the type of rendering (area and shapes).protected PolygonpAreaArea of the complete seriesstatic intSHAPESUseful constant for specifying the type of rendering (shapes only).Fields inherited from class org.jfree.chart.renderer.AbstractRenderer
DEFAULT_OUTLINE_PAINT, DEFAULT_OUTLINE_STROKE, DEFAULT_PAINT, DEFAULT_SHAPE, DEFAULT_STROKE, DEFAULT_VALUE_LABEL_FONT, DEFAULT_VALUE_LABEL_PAINT, ZERO -
Constructor Summary
Constructors Constructor Description XYStepAreaRenderer()Constructs a new renderer.XYStepAreaRenderer(int type)Constructs a new renderer.XYStepAreaRenderer(int type, XYToolTipGenerator toolTipGenerator, XYURLGenerator urlGenerator)Constructs a new renderer. -
Method Summary
Modifier and Type Method Description Objectclone()Returns a clone of the renderer.voiddrawItem(Graphics2D g2, XYItemRendererState state, Rectangle2D dataArea, PlotRenderingInfo info, XYPlot plot, ValueAxis domainAxis, ValueAxis rangeAxis, XYDataset dataset, int series, int item, CrosshairState crosshairState, int pass)Draws the visual representation of a single data item.booleanequals(Object obj)Tests this renderer for equality with an arbitrary object.booleangetPlotArea()Returns true if Area is being plotted by the renderer.doublegetRangeBase()Returns the value on the range axis which defines the 'lower' border of the area.booleangetShapesVisible()Returns true if shapes are being plotted by the renderer.doublegetStepPoint()Returns the fraction of the domain position between two points on which the step is drawn.XYItemRendererStateinitialise(Graphics2D g2, Rectangle2D dataArea, XYPlot plot, XYDataset data, PlotRenderingInfo info)Initialises the renderer.booleanisOutline()Returns a flag that controls whether or not outlines of the areas are drawn.booleanisShapesFilled()Returns the flag that controls whether or not the shapes are filled.protected static doublerestrictValueToDataArea(double value, XYPlot plot, Rectangle2D dataArea)Helper method which returns a value if it lies inside the visible dataArea and otherwise the corresponding coordinate on the border of the dataArea.voidsetOutline(boolean show)Sets a flag that controls whether or not outlines of the areas are drawn, and sends aRendererChangeEventto all registered listeners.voidsetPlotArea(boolean flag)Sets a flag that controls whether or not areas are drawn for each data item and sends aRendererChangeEventto all registered listeners.voidsetRangeBase(double val)Sets the value on the range axis which defines the default border of the area, and sends aRendererChangeEventto all registered listeners.voidsetShapesFilled(boolean filled)Sets the 'shapes filled' for ALL series and sends aRendererChangeEventto all registered listeners.voidsetShapesVisible(boolean flag)Sets the flag that controls whether or not shapes are displayed for each data item, and sends aRendererChangeEventto all registered listeners.voidsetStepPoint(double stepPoint)Sets the step point and sends aRendererChangeEventto all registered listeners.Methods inherited from class org.jfree.chart.renderer.xy.AbstractXYItemRenderer
addAnnotation, addAnnotation, addEntity, annotationChanged, beginElementGroup, calculateDomainMarkerTextAnchorPoint, drawAnnotations, drawDomainLine, drawDomainMarker, drawItemLabel, drawRangeLine, drawRangeMarker, fillDomainGridBand, fillRangeGridBand, findDomainBounds, findDomainBounds, findRangeBounds, findRangeBounds, getAnnotations, getDefaultItemLabelGenerator, getDefaultToolTipGenerator, getDrawingSupplier, getItemLabelGenerator, getLegendItem, getLegendItemLabelGenerator, getLegendItems, getLegendItemToolTipGenerator, getLegendItemURLGenerator, getPassCount, getPlot, getSeriesItemLabelGenerator, getSeriesToolTipGenerator, getToolTipGenerator, getURLGenerator, lineTo, moveTo, removeAnnotation, removeAnnotations, setDefaultItemLabelGenerator, setDefaultToolTipGenerator, setLegendItemLabelGenerator, setLegendItemToolTipGenerator, setLegendItemURLGenerator, setPlot, setSeriesItemLabelGenerator, setSeriesToolTipGenerator, setURLGenerator, updateCrosshairValuesMethods inherited from class org.jfree.chart.renderer.AbstractRenderer
addChangeListener, beginElementGroup, calculateLabelAnchorPoint, clearSeriesPaints, clearSeriesStrokes, endElementGroup, fireChangeEvent, getAutoPopulateSeriesFillPaint, getAutoPopulateSeriesOutlinePaint, getAutoPopulateSeriesOutlineStroke, getAutoPopulateSeriesPaint, getAutoPopulateSeriesShape, getAutoPopulateSeriesStroke, getDataBoundsIncludesVisibleSeriesOnly, getDefaultCreateEntities, getDefaultEntityRadius, getDefaultFillPaint, getDefaultItemLabelFont, getDefaultItemLabelPaint, getDefaultItemLabelsVisible, getDefaultLegendShape, getDefaultLegendTextFont, getDefaultLegendTextPaint, getDefaultNegativeItemLabelPosition, getDefaultOutlinePaint, getDefaultOutlineStroke, getDefaultPaint, getDefaultPositiveItemLabelPosition, getDefaultSeriesVisible, getDefaultSeriesVisibleInLegend, getDefaultShape, getDefaultStroke, getItemCreateEntity, getItemFillPaint, getItemLabelAnchorOffset, getItemLabelFont, getItemLabelPaint, getItemOutlinePaint, getItemOutlineStroke, getItemPaint, getItemShape, getItemStroke, getItemVisible, getLegendShape, getLegendTextFont, getLegendTextPaint, getNegativeItemLabelPosition, getPositiveItemLabelPosition, getSeriesCreateEntities, getSeriesFillPaint, getSeriesItemLabelFont, getSeriesItemLabelPaint, getSeriesNegativeItemLabelPosition, getSeriesOutlinePaint, getSeriesOutlineStroke, getSeriesPaint, getSeriesPositiveItemLabelPosition, getSeriesShape, getSeriesStroke, getSeriesVisible, getSeriesVisibleInLegend, getTreatLegendShapeAsLine, hashCode, hasListener, isItemLabelVisible, isSeriesItemLabelsVisible, isSeriesVisible, isSeriesVisibleInLegend, lookupLegendShape, lookupLegendTextFont, lookupLegendTextPaint, lookupSeriesFillPaint, lookupSeriesOutlinePaint, lookupSeriesOutlineStroke, lookupSeriesPaint, lookupSeriesShape, lookupSeriesStroke, notifyListeners, removeChangeListener, setAutoPopulateSeriesFillPaint, setAutoPopulateSeriesOutlinePaint, setAutoPopulateSeriesOutlineStroke, setAutoPopulateSeriesPaint, setAutoPopulateSeriesShape, setAutoPopulateSeriesStroke, setDataBoundsIncludesVisibleSeriesOnly, setDefaultCreateEntities, setDefaultCreateEntities, setDefaultEntityRadius, setDefaultFillPaint, setDefaultFillPaint, setDefaultItemLabelFont, setDefaultItemLabelFont, setDefaultItemLabelPaint, setDefaultItemLabelPaint, setDefaultItemLabelsVisible, setDefaultItemLabelsVisible, setDefaultLegendShape, setDefaultLegendTextFont, setDefaultLegendTextPaint, setDefaultNegativeItemLabelPosition, setDefaultNegativeItemLabelPosition, setDefaultOutlinePaint, setDefaultOutlinePaint, setDefaultOutlineStroke, setDefaultOutlineStroke, setDefaultPaint, setDefaultPaint, setDefaultPositiveItemLabelPosition, setDefaultPositiveItemLabelPosition, setDefaultSeriesVisible, setDefaultSeriesVisible, setDefaultSeriesVisibleInLegend, setDefaultSeriesVisibleInLegend, setDefaultShape, setDefaultShape, setDefaultStroke, setDefaultStroke, setItemLabelAnchorOffset, setLegendShape, setLegendTextFont, setLegendTextPaint, setSeriesCreateEntities, setSeriesCreateEntities, setSeriesFillPaint, setSeriesFillPaint, setSeriesItemLabelFont, setSeriesItemLabelFont, setSeriesItemLabelPaint, setSeriesItemLabelPaint, setSeriesItemLabelsVisible, setSeriesItemLabelsVisible, setSeriesItemLabelsVisible, setSeriesNegativeItemLabelPosition, setSeriesNegativeItemLabelPosition, setSeriesOutlinePaint, setSeriesOutlinePaint, setSeriesOutlineStroke, setSeriesOutlineStroke, setSeriesPaint, setSeriesPaint, setSeriesPositiveItemLabelPosition, setSeriesPositiveItemLabelPosition, setSeriesShape, setSeriesShape, setSeriesStroke, setSeriesStroke, setSeriesVisible, setSeriesVisible, setSeriesVisibleInLegend, setSeriesVisibleInLegend, setTreatLegendShapeAsLineMethods inherited from class java.lang.Object
finalize, getClass, notify, notifyAll, toString, wait, wait, waitMethods inherited from interface org.jfree.chart.LegendItemSource
getLegendItemsMethods inherited from interface org.jfree.chart.renderer.xy.XYItemRenderer
addAnnotation, addAnnotation, addChangeListener, drawAnnotations, drawDomainLine, drawDomainMarker, drawRangeLine, drawRangeMarker, fillDomainGridBand, fillRangeGridBand, findDomainBounds, findRangeBounds, getDefaultCreateEntities, getDefaultFillPaint, getDefaultItemLabelFont, getDefaultItemLabelGenerator, getDefaultItemLabelPaint, getDefaultItemLabelsVisible, getDefaultNegativeItemLabelPosition, getDefaultOutlinePaint, getDefaultOutlineStroke, getDefaultPaint, getDefaultPositiveItemLabelPosition, getDefaultSeriesVisible, getDefaultSeriesVisibleInLegend, getDefaultShape, getDefaultStroke, getDefaultToolTipGenerator, getItemCreateEntity, getItemFillPaint, getItemLabelFont, getItemLabelGenerator, getItemLabelPaint, getItemOutlinePaint, getItemOutlineStroke, getItemPaint, getItemShape, getItemStroke, getItemVisible, getLegendItem, getLegendItemLabelGenerator, getNegativeItemLabelPosition, getPassCount, getPlot, getPositiveItemLabelPosition, getSeriesCreateEntities, getSeriesFillPaint, getSeriesItemLabelFont, getSeriesItemLabelGenerator, getSeriesItemLabelPaint, getSeriesNegativeItemLabelPosition, getSeriesOutlinePaint, getSeriesOutlineStroke, getSeriesPaint, getSeriesPositiveItemLabelPosition, getSeriesShape, getSeriesStroke, getSeriesToolTipGenerator, getSeriesVisible, getSeriesVisibleInLegend, getToolTipGenerator, getURLGenerator, isItemLabelVisible, isSeriesItemLabelsVisible, isSeriesVisible, isSeriesVisibleInLegend, removeAnnotation, removeAnnotations, removeChangeListener, setDefaultCreateEntities, setDefaultCreateEntities, setDefaultFillPaint, setDefaultFillPaint, setDefaultItemLabelFont, setDefaultItemLabelGenerator, setDefaultItemLabelPaint, setDefaultItemLabelsVisible, setDefaultItemLabelsVisible, setDefaultNegativeItemLabelPosition, setDefaultNegativeItemLabelPosition, setDefaultOutlinePaint, setDefaultOutlinePaint, setDefaultOutlineStroke, setDefaultOutlineStroke, setDefaultPaint, setDefaultPaint, setDefaultPositiveItemLabelPosition, setDefaultPositiveItemLabelPosition, setDefaultSeriesVisible, setDefaultSeriesVisible, setDefaultSeriesVisibleInLegend, setDefaultSeriesVisibleInLegend, setDefaultShape, setDefaultShape, setDefaultStroke, setDefaultStroke, setDefaultToolTipGenerator, setLegendItemLabelGenerator, setPlot, setSeriesCreateEntities, setSeriesCreateEntities, setSeriesFillPaint, setSeriesFillPaint, setSeriesItemLabelFont, setSeriesItemLabelGenerator, setSeriesItemLabelPaint, setSeriesItemLabelsVisible, setSeriesItemLabelsVisible, setSeriesItemLabelsVisible, setSeriesNegativeItemLabelPosition, setSeriesNegativeItemLabelPosition, setSeriesOutlinePaint, setSeriesOutlinePaint, setSeriesOutlineStroke, setSeriesOutlineStroke, setSeriesPaint, setSeriesPaint, setSeriesPositiveItemLabelPosition, setSeriesPositiveItemLabelPosition, setSeriesShape, setSeriesShape, setSeriesStroke, setSeriesStroke, setSeriesToolTipGenerator, setSeriesVisible, setSeriesVisible, setSeriesVisibleInLegend, setSeriesVisibleInLegend, setURLGenerator
-
Field Details
-
SHAPES
Useful constant for specifying the type of rendering (shapes only).- See Also:
- Constant Field Values
-
AREA
Useful constant for specifying the type of rendering (area only).- See Also:
- Constant Field Values
-
AREA_AND_SHAPES
Useful constant for specifying the type of rendering (area and shapes).- See Also:
- Constant Field Values
-
pArea
Area of the complete series
-
-
Constructor Details
-
XYStepAreaRenderer
public XYStepAreaRenderer()Constructs a new renderer. -
XYStepAreaRenderer
Constructs a new renderer.- Parameters:
type- the type of the renderer.
-
XYStepAreaRenderer
public XYStepAreaRenderer(int type, XYToolTipGenerator toolTipGenerator, XYURLGenerator urlGenerator)Constructs a new renderer.To specify the type of renderer, use one of the constants: AREA, SHAPES or AREA_AND_SHAPES.
- Parameters:
type- the type of renderer.toolTipGenerator- the tool tip generator to use (nullpermitted).urlGenerator- the URL generator (nullpermitted).
-
-
Method Details
-
isOutline
Returns a flag that controls whether or not outlines of the areas are drawn.- Returns:
- The flag.
- See Also:
setOutline(boolean)
-
setOutline
Sets a flag that controls whether or not outlines of the areas are drawn, and sends aRendererChangeEventto all registered listeners.- Parameters:
show- the flag.- See Also:
isOutline()
-
getShapesVisible
Returns true if shapes are being plotted by the renderer.- Returns:
trueif shapes are being plotted by the renderer.- See Also:
setShapesVisible(boolean)
-
setShapesVisible
Sets the flag that controls whether or not shapes are displayed for each data item, and sends aRendererChangeEventto all registered listeners.- Parameters:
flag- the flag.- See Also:
getShapesVisible()
-
isShapesFilled
Returns the flag that controls whether or not the shapes are filled.- Returns:
- A boolean.
- See Also:
setShapesFilled(boolean)
-
setShapesFilled
Sets the 'shapes filled' for ALL series and sends aRendererChangeEventto all registered listeners.- Parameters:
filled- the flag.- See Also:
isShapesFilled()
-
getPlotArea
Returns true if Area is being plotted by the renderer.- Returns:
trueif Area is being plotted by the renderer.- See Also:
setPlotArea(boolean)
-
setPlotArea
Sets a flag that controls whether or not areas are drawn for each data item and sends aRendererChangeEventto all registered listeners.- Parameters:
flag- the flag.- See Also:
getPlotArea()
-
getRangeBase
Returns the value on the range axis which defines the 'lower' border of the area.- Returns:
doublethe value on the range axis which defines the 'lower' border of the area.- See Also:
setRangeBase(double)
-
setRangeBase
Sets the value on the range axis which defines the default border of the area, and sends aRendererChangeEventto all registered listeners. E.g. setRangeBase(Double.NEGATIVE_INFINITY) lets areas always reach the lower border of the plotArea.- Parameters:
val- the value on the range axis which defines the default border of the area.- See Also:
getRangeBase()
-
getStepPoint
Returns the fraction of the domain position between two points on which the step is drawn. The default is 1.0d, which means the step is drawn at the domain position of the second`point. If the stepPoint is 0.5d the step is drawn at half between the two points.- Returns:
- The fraction of the domain position between two points where the step is drawn.
- See Also:
setStepPoint(double)
-
setStepPoint
Sets the step point and sends aRendererChangeEventto all registered listeners.- Parameters:
stepPoint- the step point (in the range 0.0 to 1.0)- See Also:
getStepPoint()
-
initialise
public XYItemRendererState initialise(Graphics2D g2, Rectangle2D dataArea, XYPlot plot, XYDataset data, PlotRenderingInfo info)Initialises the renderer. Here we calculate the Java2D y-coordinate for zero, since all the bars have their bases fixed at zero.- Specified by:
initialisein interfaceXYItemRenderer- Overrides:
initialisein classAbstractXYItemRenderer- Parameters:
g2- the graphics device.dataArea- the area inside the axes.plot- the plot.data- the data.info- an optional info collection object to return data back to the caller.- Returns:
- The number of passes required by the renderer.
-
drawItem
public void drawItem(Graphics2D g2, XYItemRendererState state, Rectangle2D dataArea, PlotRenderingInfo info, XYPlot plot, ValueAxis domainAxis, ValueAxis rangeAxis, XYDataset dataset, int series, int item, CrosshairState crosshairState, int pass)Draws the visual representation of a single data item.- Specified by:
drawItemin interfaceXYItemRenderer- Parameters:
g2- the graphics device.state- the renderer state.dataArea- the area within which the data is being drawn.info- collects information about the drawing.plot- the plot (can be used to obtain standard color information etc).domainAxis- the domain axis.rangeAxis- the range axis.dataset- the dataset.series- the series index (zero-based).item- the item index (zero-based).crosshairState- crosshair information for the plot (nullpermitted).pass- the pass index.
-
equals
Tests this renderer for equality with an arbitrary object.- Overrides:
equalsin classAbstractXYItemRenderer- Parameters:
obj- the object (nullpermitted).- Returns:
- A boolean.
-
clone
Returns a clone of the renderer.- Specified by:
clonein interfacePublicCloneable- Overrides:
clonein classAbstractXYItemRenderer- Returns:
- A clone.
- Throws:
CloneNotSupportedException- if the renderer cannot be cloned.
-
restrictValueToDataArea
Helper method which returns a value if it lies inside the visible dataArea and otherwise the corresponding coordinate on the border of the dataArea. The PlotOrientation is taken into account. Useful to avoid possible sun.dc.pr.PRException: endPath: bad path which occurs when trying to draw lines/shapes which in large part lie outside of the visible dataArea.- Parameters:
value- the value which shall bedataArea- the area within which the data is being drawn.plot- the plot (can be used to obtain standard color information etc).- Returns:
doublevalue inside the data area.
-